NHS in numbers: service costs
NHS accounts – be they national or local – are very good at telling us what has been spent on NHS services and the costs of staff, drugs and other resources in delivering services overall. But they tell us very little about how much it costs every time a patient is admitted to hospital, attends an outpatient appointment or is visited by a district nurse.
However, average costs of specific interventions can be found in an annual reference costs publication – the latest of which, released in November last year, covers 2017/18.
The cost data is used in a number of ways. It informs both the national tariff that sets the prices commissioners pay to acute hospitals, where activity based contracts are in place, and local prices. It is used in benchmarking data and to estimate the value of improvement opportunities, such as those highlighted in the Model Hospital and Getting it right first time. In addition, it helps Parliament to see how funds are being spent.
While there are issues with the data, it does provide useful information of the costs of simple and complex interactions with the NHS.
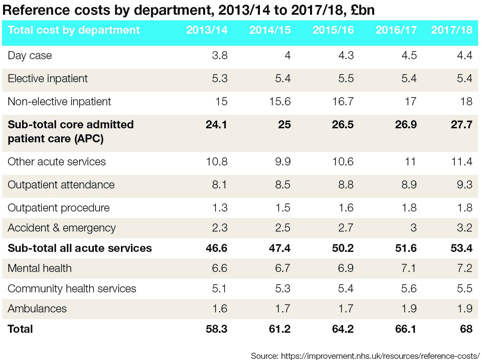
The most recently collected reference costs (for 2017/18) cover £68bn of expenditure (62% of total NHS spending in England). This includes core admitted patient care costs (APC) of £27.7bn, mental health costs of £7.2bn, community care £5.5bn and ambulance costs of £1.9bn.
Breaking the costs down further, day case expenditure increased from £3.8bn in 2013/14 to £4.4bn in 2017/18 (15.8%), while A&E costs increased from £2.3bn to £3.2bn (39%).
Costs increased in every department – as well as mental health, community and ambulance – except in elective inpatient, where they remained relatively stable at around £5.4bn each year.
It cost £742 on average to treat a patient in a day case setting, while this increased to £3,894 on average for an elective inpatient episode – although this excludes the costs of excess bed days (days beyond a number set for each intervention). Days beyond this trim point then cost an average of £346 per day. The average cost for an A&E attendance was £160, while for an outpatient attendance the figure was £125.
 In mental health, around 63% of expenditure (£4.5bn) was costed against clusters, with the balance costed against different units of activity – usually care contacts or single attendances.
The cost of the initial assessment (£301) may cover a number of attendances, though it is usually expected to be complete in two contacts. The unit cost per cluster day (£18 in 2017/18) is the total cost of the cluster period divided by the number of days spent in the cluster.
A reference cost index (RCI) provides a way of measuring relative cost difference between NHS providers – with an RCI of 100 equating to national average costs. A cost schedule provides the average cost of all activity broken down by the currency used in each sector.
For example, acute activity is reported in healthcare resource groups (HRGs), arranged in different specialty chapters.
So, for example, hip replacements would be found in the musculoskeletal chapter, with most of the uncomplicated ones falling in the HRG HN12F – Very major hip procedures for non-trauma with CC score 0-1.
The NHS undertook nearly 24,000 of these procedures in 2017/18 at an average cost of £6,061. Spreading the cost of excess bed days for this HRG across all episodes would add another £60 to the average cost.
Reference costs are being replaced by new more granular patient level costs. Reference costs are calculated by allocating costs down to HRGs. But patient-level costs are built up from the costs of treating individual patients. This enables trusts to explore what is driving average costs that are higher or lower than the national average.Related content
The Institute’s annual costing conference provides the NHS with the latest developments and guidance in NHS costing.
The value masterclass shares examples of organisations and systems that have pursued a value-driven approach and the results they have achieved.