NHS in numbers: healthcare across the UK
Since 1999, devolution to Scotland, Wales and Northern Ireland means that decisions about health services in the four UK nations are taken by the respective governments.
Scotland, Wales and Northern Ireland receive block grants from the UK government to fund spending on public services.
Year-to-year changes to these block grants are largely determined by the Barnett formula, which was originally devised in the late 1970s as a short-term measure to support budget negotiations.
However, the starting point for these block grants was the historical level of spending on public services.
The Barnett formula calculates the changes to these block grants so that they reflect increases in spending on relevant services in England proportional to the size of population, and taking account of whether the spending is all on services that are devolved.
An Institute for Fiscal Studies paper gives the following example: ‘If the UK government announces a £100m increase in Department of Health spending, if 99% of that department’s budget is spending in England on responsibilities that are devolved to Scotland, and if Scotland’s population is 10% of England’s, then the Scottish government’s budget would increase by £9.9m.’
While original block contracts may have been set on the basis of need, annual increases are based on unweighted headcount. So, over time, in theory, the formula should lead to convergence in spending per head. However, there are other factors at play, including the fact that if Scotland’s population relative to England declines, then its overall spending per capita will increase.
While the Barnett formula matches increases in the block grant with increases in spending on relevant services in England, devolved governments can then choose to split their block grant between different spending programmes however they want.
Despite this, a report from the National Audit Office in 2012 – Healthcare across the UK – said that since 2005/06, the proportion spent on health by each nation had remained relatively constant at between 18% and 22% of all public spending.
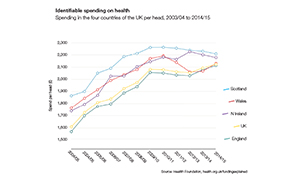
Figures from the Health Foundation (see chart) for 2014/15, illustrate that health spending per head remains highest in Scotland (£2,208) and lowest in England (£2,112).
Clear differences have emerged since devolution in the structures within the devolved nations, with Scotland and Wales ditching all vestiges of the internal market in favour of boards that both plan and deliver services.
There have also been differences in how the different services spend their money. For example, Scotland, Wales and Northern Ireland all have a policy of free prescriptions, although the vast majority of prescribed items in England are exempt from charges. Car parking in Scotland and Wales is also free.
The NAO concluded in 2012 that – looking across a number of indicators including life expectancy, spending, length of stay and emergency admissions – no single system in the UK has been consistently more economic, efficient or effective. And a report by the Nuffield Trust and the Health Foundation in 2014 – The four health systems of the United Kingdom: how do they compare? – also concluded that the increasing divergence of policies since devolution was not associated with a matching divergence of performance.
• Relative spending across the UK health systems is extensively covered in the HFMA’s level 7 advanced certificate qualification (Comparative healthcare systems module).Related content
The Institute’s annual costing conference provides the NHS with the latest developments and guidance in NHS costing.
The value masterclass shares examples of organisations and systems that have pursued a value-driven approach and the results they have achieved.