NHS in numbers: drugs spending
It is well known that the bill for medicines dispensed by the health service has been rising – seemingly inexorably – over the past few years. The latest NHS Digital figures show the NHS in England spent an estimated £18.2bn on drugs in 2017/18, an increase of almost 40% since 2010/11, when costs stood at £13bn.
Before examining the figures, it is worth noting that the costs presented by NHS Digital are not necessarily those the NHS actually paid. They are estimates based on list price excluding VAT and do not take account of nationally or locally negotiated prices. Hospitals are often able to access lower prices, either through a commercial access agreement or patient access schemes, such as the discount on beta interferons for the treatment of multiple sclerosis in adults.

Drugs dispensed in the community can be available at reduced cost, allowing community pharmacies to generate a margin that is taken into account in their funding arrangements. NHS Digital says £800m of margin earned on medicines contributes to the provision of pharmaceutical services.
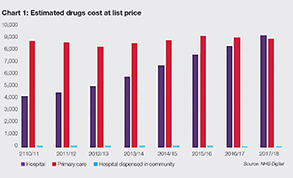
Setting this aside, the overall figure is rising, and medicines dispensed in hospitals now make up more than 50% of the overall estimated NHS drugs bill (see chart 1). Conversely, the proportion prescribed and dispensed in primary care – traditionally much higher – fell from 66.5% in 2010/11 to 48.9% in 2017/18.
The cost of medicines dispensed in primary care has risen, but at a much slower rate than the rise in costs in hospitals. The estimated bill for medicines in primary care increased from £8.6bn in 2010/11 to almost £8.9bn in 2017/18 (a 3.5% increase). The hospital medicine bill stood at £9.2bn in 2017/18 – a 119% rise on 2010/11.
In 2017/18, the total hospital cost at list price increased by 10.8% on the previous year, while in primary care it decreased by 1%.
The shift in the cost of medicines dispensed in hospital is due not only to the rising cost of drugs, but also the introduction of new and innovative treatments, as well as the greater use of specialist medicines. Of the drugs appraised by the National Institute for Health and Care Excellence in 2017/18, the greatest overall cost was for Adalimumab, used to treat autoimmune conditions – it cost the NHS £494.5m in 2017/18, £471m of which was incurred in hospitals.
Indeed, of the top 20 drugs on which the NHS spends most, only three incur higher costs in primary care than in secondary care.
One of these three is insulin glargine (£83.7m in 2017/18), used to treat type 1 diabetes, but there is concern about the rising costs of treating all types of diabetes. The prevalence of diabetes in England was 6.8% in 2017/18, but this is expected to rise. Based on current trends, it could increase to more than 8% by 2035.
Overall, drugs used in diabetes accounted for 11.4% of the total primary care net ingredient costs (NICs) in 2017/18, as well as 4.9% of all prescription items. NICs are also based on list prices, but they may differ from actual costs as they exclude charges, for example, for containers or delivery.

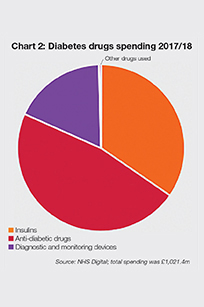
NHS Digital says just over £1bn was spent on diabetes prescribing, almost £422m more than in 2007/08, a rise of around 71%. Anti-diabetic drugs – taken orally to help manage sugar levels in the bloodstream, which are generally used in type 2 diabetes mellitus – made up
the biggest proportion of the costs (47%) at £476.7m.
All insulins, including insulin glargine, accounted for £350.5m, while £181m was spent on diagnostic and monitoring devices (see chart 2).
The rise in the cost of anti-diabetic drugs has been due to an increase in the volume of prescriptions and higher costs.
The latter followed the introduction of new, more expensive drugs and changes to prices under the category M scheme (which manages cost rises due to market forces) and the PPRS (pharmaceutical price regulation scheme).
Related content
The Institute’s annual costing conference provides the NHS with the latest developments and guidance in NHS costing.
The value masterclass shares examples of organisations and systems that have pursued a value-driven approach and the results they have achieved.