Feature / Community cost centre
 There have been significant improvements in costing in recent years, in particular with moves to patient-level costing. But the focus has been on acute services – and to a lesser extent mental health. However, there is a clear recognition that community services need to catch up – evidenced by Monitor bringing forward the implementation programme for community activity as part of its Costing Transformation Programme.
Data is perhaps the standout issue. ‘A recurrent theme by senior policy makers at a recent HFMA seminar was the lack of data concerning community services,’ says Roy Jackson, interim finance director of Lincolnshire Community Health Services NHS Trust.
This should not be surprising, he adds. ‘The level of preparatory work undertaken in the acute sector to make it data-ready for national tariffs was not repeated for other areas of care. Community services have followed behind both the acute and mental health sectors in receiving a comprehensive minimum data set.’
According to Monitor, Lincolnshire is one of only two community trusts to have implemented patient-level information and costing systems (PLICS). It still has some distance to go – particularly in terms of getting the use of data embedded into the day-to-day management of services. But it still has a lot of experience that would benefit other community trusts and integrated providers.
Ahead of the game
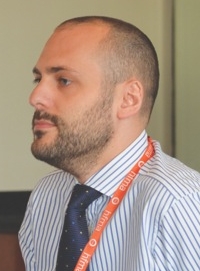
Lincolnshire’s head start dates from becoming an independent trust in 2011. ‘There was recognition that we needed a costing system and data warehouse,’ says Matt Miles (pictured), who joined the trust the following year as service line reporting and costing accountant.
But the trust also wanted to firm up its out-of-area activity payment – a sum that was material at about £1.5m. ‘Lincolnshire attracts a significant holiday population down its east coast, with seaside towns such as Skegness and Mablethorpe, and this leads to a lot of out-of-area activity,’ says Mr Miles. ‘We wanted to be able to record this activity accurately and bill commissioners.’
The trust procured the CACI Synergy costing system to use alongside its SystmOne clinical system and in 2012/13 it shared some service line reporting scenarios with clinical teams to show what it could do. The aim was to get teams to take more ownership of their activity and costs and to improve the trust’s reference costs submission. The trust then delayed taking real data out to the organisation in favour of improving its counting of core activity and ensuring comprehensive collection.
Alongside this work, in part to define the boundaries of its service provision in contracts, Lincolnshire also developed a catalogue of its community nursing interventions with model timings. This methodology, shared with community providers in Rotherham and Norfolk, has supported the trust’s subsequent patient-level variance analysis work. Developing similar data for its other services is an area of planned future work.
Initially, the trust used nursing teams as its core cost centres, but it soon opted for a more granular approach of creating cost pools for individual clinicians, which can then be assigned to different activity using time as the core driver.
Pay and travel costs are allocated directly to these individual cost centres with indirect costs and overheads apportioned as a secondary step. These costs are then allocated to patients using the HFMA acute costing standards as a guide to the best allocation methods.
The cost of a contact – which remains the key currency in community service reference costs – is then calculated by multiplying the duration of the contact by the cost per minute of the individual clinician delivering the care. However, the system also enables whole patient pathways, showing various contacts and costs, to be viewed and compared.
Even with a less comprehensive data set compared with acute providers, community providers will typically know which patients are seen on a particular day by a clinician or team. But they may not know how long was spent with each patient, what interventions there were and how much time was spent on travelling or administration.
Lincolnshire bucks this particular caricature with a good information base. Mr Miles estimates that about 90% of its activity is in its main clinical system (SystmOne) and available at the patient level. (Non-patient-level systems and data include dental and some aspects of school nursing). The system has been in use by its services for about nine years and staff are well trained and broadly capturing the right level of detail.
Giving laptops to all clinicians as the trust was set up has helped, enabling clinicians to become more mobile and to record what they are doing during, or as close as possible to, an intervention. Internet connectivity across the patch presents challenges to this aim, but mobile working is crucial to empowering clinicians and improving team productivity, reducing travelling time between patient visits and the office to input data.
In the absence of nationally prescribed data sets, Lincolnshire has worked with clinicians to identify the data needed to analyse activity and produce costs. ‘There are three main bits of information we need,’ says Mr Miles. ‘The principal one is to actually record the contact and intervention.’
This includes noting the time, using free text boxes for the traditional patient notes, tick boxes to select any vital signs that have been measured, such as blood pressure, and then a dropdown menu to select any interventions or actions undertaken. This might include, for example, leg ulcer wound care or the compiling of a care plan.
‘Next, we need to know how long they spend on each activity,’ he says. ‘So they might record they spent 30 minutes with a patient, with 15 minutes on the wound care and 15 minutes on the care plan. Finally, we want clinicians to record the location of care as accurately as possible.’
This information enables the costing team to identify care, travel and admin time and understand what is actually being done for patients.
Travel time is one of the bedevilling issues facing community services as they look to improve costing. Feedback from an HFMA community provider costing group is that trusts currently assign costs in a variety of ways. Options include assigning all costs associated with travel time as an overhead across all activity, assigning a specific day’s travel time costs across all patients seen that day or assigning travel time before seeing a patient to that patient.
It is hoped that a consistent approach will emerge as part of the current national development work on costing. In Lincolnshire, all of a clinician’s pay and travel goes across all the clinicians’ patients, whereas some trusts allocate particular journeys to individual patients.
Where clinicians do not record time spent with patients – or for specific interventions – the costing team has to estimate time spent based on other practitioners’ entries.
There are also holes in the patient-level data, some of which are within the trust’s gift to improve and others where a solution has yet to present itself. While sexual health data is at the patient level, for example, it doesn’t use an NHS number so can’t be joined up to provide a complete patient pathway. The trust has an anticoagulation service where it just receives details of total contacts and so ends up with just an average cost per contact. Again, the trust is reviewing how to improve this.
‘We are now in the position where we have a great tool and great data,’ says Mr Miles. ‘The key challenge now is we need the clinicians to start using it.’ The response has been enthusiastic, with some clinicians asking for sessions on service line reporting (comparing patient expenditure from the costing system with income, using national reference costs as notional prices).
Members of the costing team sit down with the clinical teams to look at PLICS data alongside SystmOne clinical data. But the aim is to get management accountants taking the data out to the teams as part of the regular budget-reporting process. Keen clinicians have also been given licences so they can access the data whenever they want, using the QlikView reporting tool – with the costing team providing additional analysis on request.
Mr Miles says the trust recognises that the next step forward with clinical engagement would be to move to monthly reporting. The current quarterly reporting means that a couple of months in, some of the patient data can be five months out of date.
He recognises there would be real benefits in being able to marry up clinicians’ recent experiences – patients seen in the past four weeks – with the cost data. The trust hopes to move to monthly reporting within the next six months, while also enabling daily or weekly downloads of activity to help managers spot potential issues early.
But Mr Miles says there is real power in getting clinicians to look at the data. ‘When you show them the patient data, understandably they home in on the clinical elements,’ he says. ‘So they might question why a band 6 in the health visiting team has been visiting a particular family so frequently, when the real aim should be to get the family more independent and calling on the health visitors only when needed. What the cost data does is underline the cost associated with this variation in practice.’ If the variation is justified, fine, but if it doesn’t represent best practice, the data shows both how services can improve and costs can be reduced.
Data mining: reports help focus on variation

Corporate overheads
It is not just operational teams that are being pushed to understand their costs. The patient costs also highlight the level of overheads, so corporate team costs are also under the spotlight, with functions taking part in a national benchmarking exercise to help frame change.
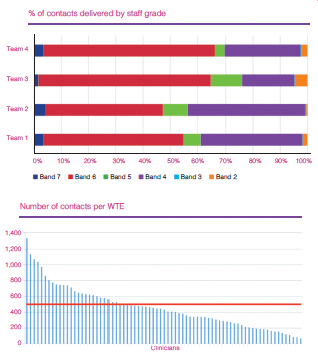
For the clinical teams, the trust has focused on a number of reports and analyses. For example, it has undertaken some deep dives to look at the percentage of contacts in different teams undertaken by different grades of staff – highlighting significant variation. It can also compare the number of contacts delivered by different members of each team
(see charts above).
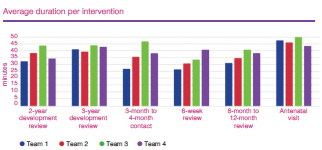
And it can focus on the time clinicians spend delivering specific interventions – enabling teams to discuss variations, establish best practice and make any changes. Looking at working patterns across a day allows practices to be challenged, with mobile working and better connectivity potentially enabling these patterns to be revised.
Mr Miles says the other key issue is to factor in outcomes. ‘We recognise that the cost and activity data only tell part of the story,’ he says. A longer, more expensive contact may lead to a better outcome or reduce the number of contacts needed, so understanding outcomes and quality is important. The trust is already looking at how it could build in key engagement indicators already collected as part of contracting requirements such as friends and family test results and ‘did not attends’.
While the trust is focused on getting the data used, it recognises that improving data quality is a constant requirement. It is now on the agenda of performance management regime meetings, which look at safety, caring, effectiveness, responsiveness and executive assurance. Specific areas under the spotlight include the level of contemporaneous records, recording outside of the time limit and the percentage of interventions and length of time not being recorded.
Outside this, the trust will keep one eye on the Monitor-driven proposals as part of its Costing Transformation Programme to see
how it may need to amend its current approach to align with new standards and guidance.
Mr Jackson is convinced that better understanding of clinical variation, facilitated by patient-level costing, will lead to cost efficiency gains. He says these will be realised more readily with this approach than by seeking clinical buy-in to the data through a ‘managing the money’ route. But having an exemplar costing system is not an end in itself,’ he says. ‘The challenge in taking patient-level costing forward successfully within community services is, as for other sectors, the engagement of its clinical staff.’
Related content
The Institute’s annual costing conference provides the NHS with the latest developments and guidance in NHS costing.
The value masterclass shares examples of organisations and systems that have pursued a value-driven approach and the results they have achieved.